
CI&T case study: how a mobility pilot tripled modal shift in 5 months
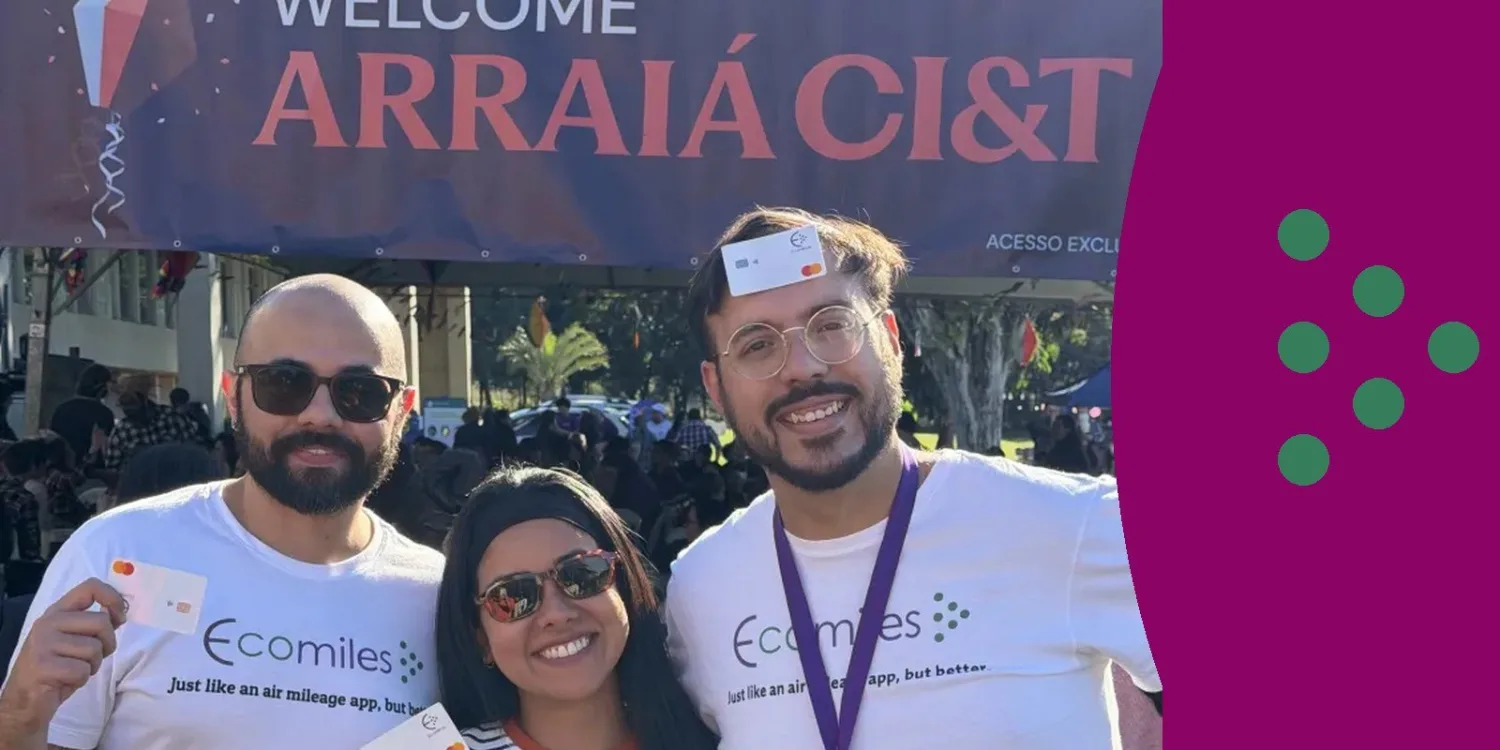
Scope 3 category 7 — employee commuting — is one of the hardest categories to measure and, by far, the hardest to reduce. Measuring already means leaving spreadsheet estimates behind and getting to primary data. Reducing requires something no inventory delivers on its own: getting hundreds of people to actually change how they get to work every day.
Between December 2025 and June 2026, CI&T ran a pilot of the Ecomiles program with its employees. Results were measured in two waves of perception surveys, run by CI&T's own Environmental Sustainability team, and cross-checked against the platform's operational data.
The indicator that matters most went from 14.6% to 38%.
The pilot in numbers
The program was opened to employees in two phases — the first from December 2025 to March 2026, the second from March to June 2026 — with perception surveys at the end of each (n=41 and n=37, voluntary and anonymous).
- 399 employees enrolled, equivalent to 57% coverage of the target audience
- 11,865 validated trips over the pilot
- 9.55 tCO₂e of avoided emissions
- 21,062 ecomiles generated and distributed to participants
- 48.7% of trips logged on sustainable modes
The result that matters: 38% changed how they commute
Modal shift is the actual change in the mode of transport used for the daily commute. It is the indicator that connects directly to the Scope 3 reduction target in the company's GHG inventory — and the hardest one to move, because it depends on habit, not communication.
In phase 1, 14.6% of respondents said they had changed or partially changed how they commute. In phase 2, 38%.
That is +23.4 percentage points in five months — almost three times the initial result. This is not stated intent in an engagement survey: it is behavior reported by people who were logging GPS-verified trips every day.
Active engagement jumped 35 points
Engagement programs die of silent abandonment. The most revealing data point of the pilot is the opposite of that:
| Frequency of use | Phase 1 | Phase 2 |
|---|---|---|
| Daily | 12.2% | 51.4% |
| Weekly | 31.7% | 35.1% |
| Active engagement (daily + weekly) | 51.2% | 86.5% |
| Sporadic or almost none | 56.1% | 13.5% |
Daily use went from 12.2% to 51.4%. The group that "barely used it" dropped from 48.8% to 5.4%. In practice: the program stopped being a campaign people remember now and then and became part of the routine of going to work.
Environmental awareness rose with it
The survey measured five environmental-perception indicators. Two of them moved significantly between phases:
- "The initiative increased my engagement with corporate sustainability" — from 61% to 78% "yes" (89% adding "yes" and "partially"). Up 17 points.
- "I felt my participation contributed to reducing emissions" — from 49% to 62% "yes". Up 13 points.
- "The app helped me understand how my commute generates emissions" — 62% "yes", 89% adding "yes" and "partially".
The first is the most strategic of the five. It shows the effect is not contained to mobility: employees start to associate their own daily choice with the company's environmental agenda. That is the difference between a transport benefit and a culture program.
The insight that applies to any engagement program
Among the recommendations CI&T's team recorded for the roll-out, one applies to any company designing a program like this:
Success should not be measured by sign-ups — easy to inflate — but by the percentage of employees with at least one sustainable trip per week.
Sign-ups are vanity. Stated adoption is vanity. What goes into the inventory, what becomes avoided tCO₂e and what sustains the program in year two is the recurrence of the behavior. That is the number we recommend putting on the sustainability committee's dashboard.
What participants said
"The program is well worth it. Switching to the chartered bus helped me understand the real impact of my commute."
— Employee who changed modes during the pilot
More than 90% of respondents want the program to continue. The survey also produced a list of product improvements requested by users — from redemption options to communication and onboarding — which was incorporated into our roadmap and is part of what makes a pilot useful.
What comes next
With the proof of concept from both phases, the program moves on to expansion at the Campinas operation, with more than 700 employees in scope.
The pilot showed what Ecomiles has argued from the start: auditable primary data and real rewards, together, move behavior. One measures Scope 3 with a per-trip trail. The other makes people want to take part. Apart, they become a report or a campaign. Together, they become reduction.
Want to run a pilot like this at your company? We measure Scope 3 categories 6 and 7 by GPS, with an auditable per-trip trail, and reward those who choose the lowest-emission mode. Onboarding through the app, no IT integration.
Data from the Ecomiles × CI&T pilot, Dec 2025–Jun 2026. Perception surveys run by CI&T's Environmental Sustainability team (phase 1 n=41, Mar 2026; phase 2 n=37, Jul 2026). Published with CI&T's authorization.
Want this at your company?
Decarbonization with auditable primary data and engagement employees actually enjoy.
Book a demo →